Charts your audience actually reads.
Screenshot-led Excel and Google Sheets charting guides for people who ship real reports — tutorials, fixes, free templates, and honest takes on the AI features.
Excel Charting
Master modern Excel charts without the legacy workarounds.
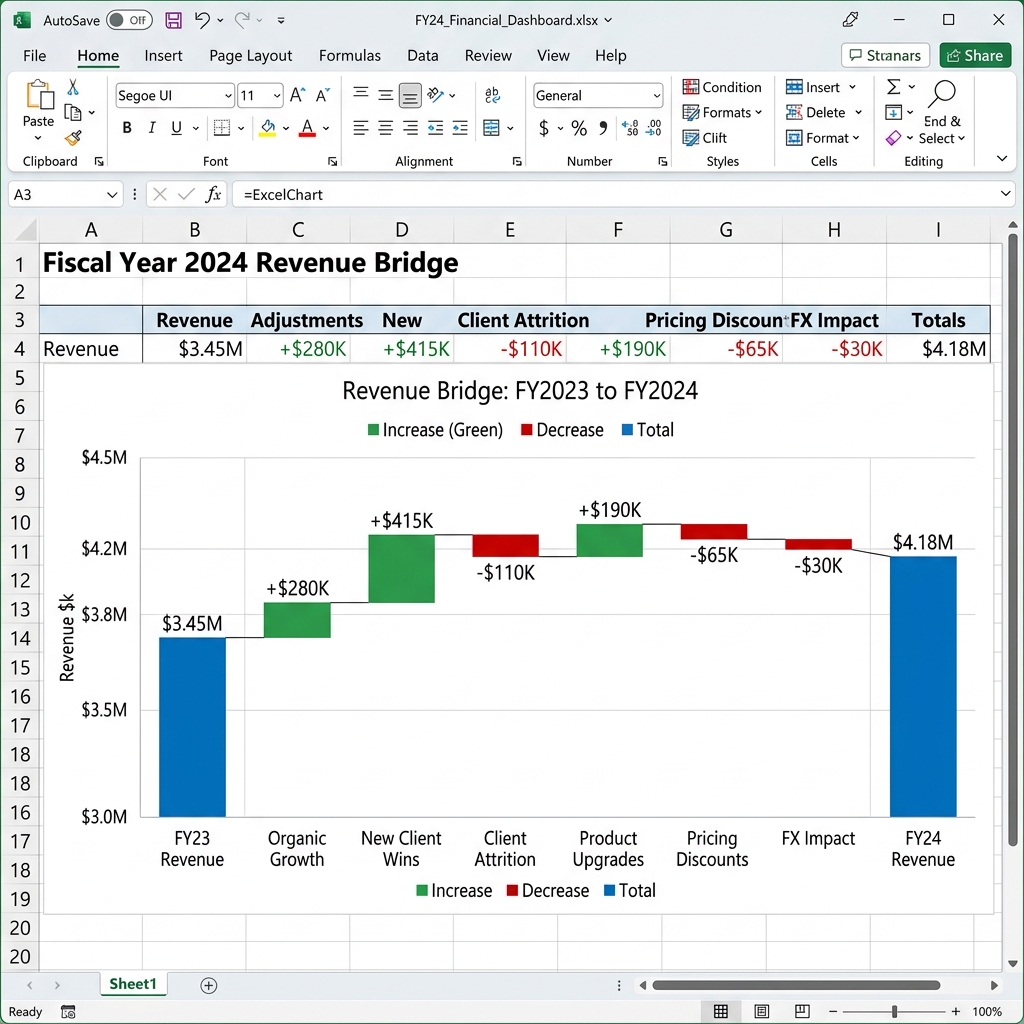
How to Make a Waterfall Chart in Excel (Modern Method + Legacy)
Build a waterfall chart in Excel the modern way with the native chart type, fix the Set as Total trap, plus a legacy fallback for older versions.
How to Make a Combo Chart in Excel (Two Chart Types, One Chart)
Build a combo chart in Excel step by step — columns plus a line, with or without a secondary axis — and learn which combinations clarify vs confuse.
Dynamic Charts in Excel: Build Charts That Update Themselves
Make Excel charts that auto-update as data grows. The modern way uses Tables and dynamic arrays — no OFFSET, no named-range gymnastics.
Google Sheets
Cloud-native charting techniques and workarounds for Google's platform.
Gemini in Google Sheets: AI Chart Generation Tested
We tested Gemini's chart generation in Google Sheets against real data tasks. What it builds well, where it falls short, and whether it saves time.
How to Make a Line Graph in Google Sheets
Build a clean line graph in Google Sheets in under a minute, then add multiple series, smoothing, and a trendline. Step-by-step with fixes.
How to Make a Gauge Chart in Google Sheets
Build a gauge chart in Google Sheets to track a single KPI, set color ranges, and know when a gauge is the wrong choice — with a better alternative.
Fix It
Chart not updating? Axis labels gone missing? Find immediate fixes for the most common spreadsheet charting errors.
View all fixes →Excel Chart Not Updating? 7 Fixes That Actually Work
Excel chart not updating with new data? The most common fix takes 10 seconds. Here are 7 fixes ordered by how often they're the cause, plus a demo file.
Excel Chart Data Labels Missing or Overlapping: 6 Fixes
Excel data labels missing, overlapping, or showing the wrong values? Six fixes ordered by how common they are, plus how to stop labels colliding for good.
Excel Chart Not Showing All Data? Here's Why (and the Fix)
Excel chart not showing all your data? The cause is almost always one of five things. Here they are, ordered by how often they're the culprit.
How to Fix Dates on an Excel Chart Axis
Excel chart showing the wrong dates? Diagnose which of 6 problems you have and fix it in minutes — with a free working file to compare against.
Templates
Ready-to-use .CRTX files and workbook templates to skip the setup.
Free Budget vs Actual Variance Chart Template for Excel
Free budget vs actual variance chart template for Excel. Pre-built formulas, a clustered column and diverging variance chart, and no email wall.
What Is a .CRTX File? Excel Chart Templates Explained (+ Free Downloads)
A .CRTX file is an Excel chart template that saves your formatting for reuse. Here's how to open, create, apply, and share them — plus free downloads.
Executive Dashboard Chart Pack: Free Excel Templates
A free Excel executive dashboard chart pack — the six charts leaders actually read, why each earns its place, and how to wire them to live data.
Free KPI Dashboard Template for Excel: 12 Charts on One Page
Download a free Excel KPI dashboard template — 12 charts on one page, powered by Tables and PivotCharts, with a data sheet ready for your own numbers.
AI Charting
Learn how to prompt ChatGPT, Copilot, and Gemini to build your charts.
How to Create Charts with Copilot in Excel: The Complete Guide
Every way Copilot makes charts in Excel — Chat, Agent Mode, Python, the COPILOT function — with prompt patterns, honest limits, and what to avoid.
Copilot Skills in Excel: Automating Financial Report Charts (Hands-On)
Microsoft's June 2026 finance Skills for Copilot in Excel, tested against the press release. What Skills actually automate in your report charts.
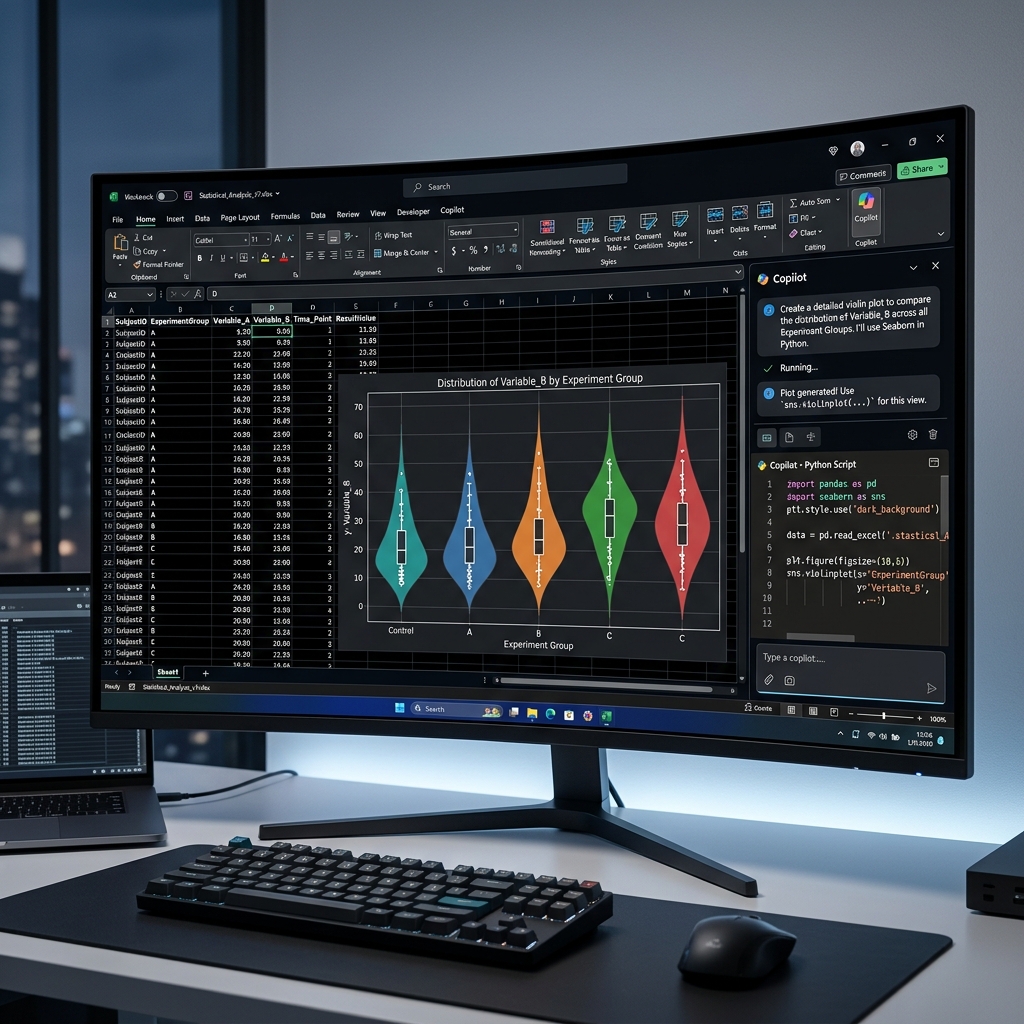
Copilot + Python in Excel: AI Chart Generation Deep Dive
How Copilot generates Python charts in Excel — matplotlib and seaborn output vs native charts, what it does well, where it fails, and when to use each.